7 mins read
How to Run a WordPress Core Web Vitals Audit Before You Hire an Agency
Share Article :


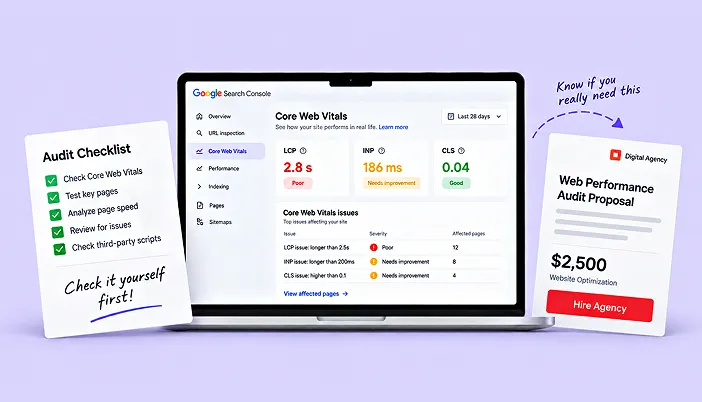
This blog walks through exactly how to run your own WordPress Core Web Vitals audit before spending money on outside help. You’ll learn which free tools to use, what to check beyond the raw scores, and how to build a WordPress speed audit checklist you can run in under an hour.
There’s a step-by-step checklist table, a practical example, and an FAQ section covering the questions people ask before deciding whether they need to hire anyone at all.
Why run your own audit before hiring anyone?
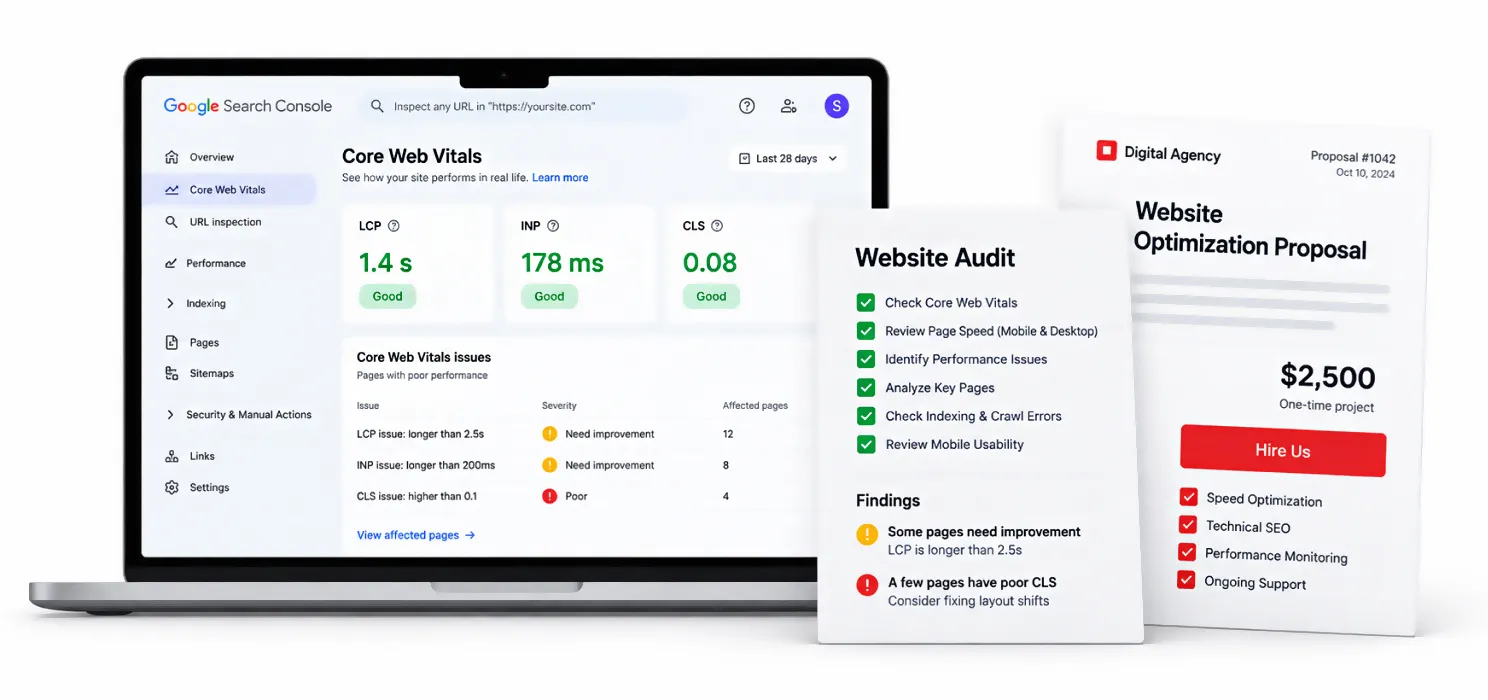
A surprising number of businesses pay for a professional audit before checking anything themselves, and often the results come back pointing at issues that were visible in Google Search Console the entire time.
Running a WordPress Core Web Vitals audit yourself first accomplishes two things. It tells you whether you actually have a problem worth paying to fix, and if you do, it gives you a clear, specific starting point so any agency you eventually hire is working from real data instead of guessing where to start. Either outcome saves money.
What tools do you need for a WordPress Core Web Vitals audit?
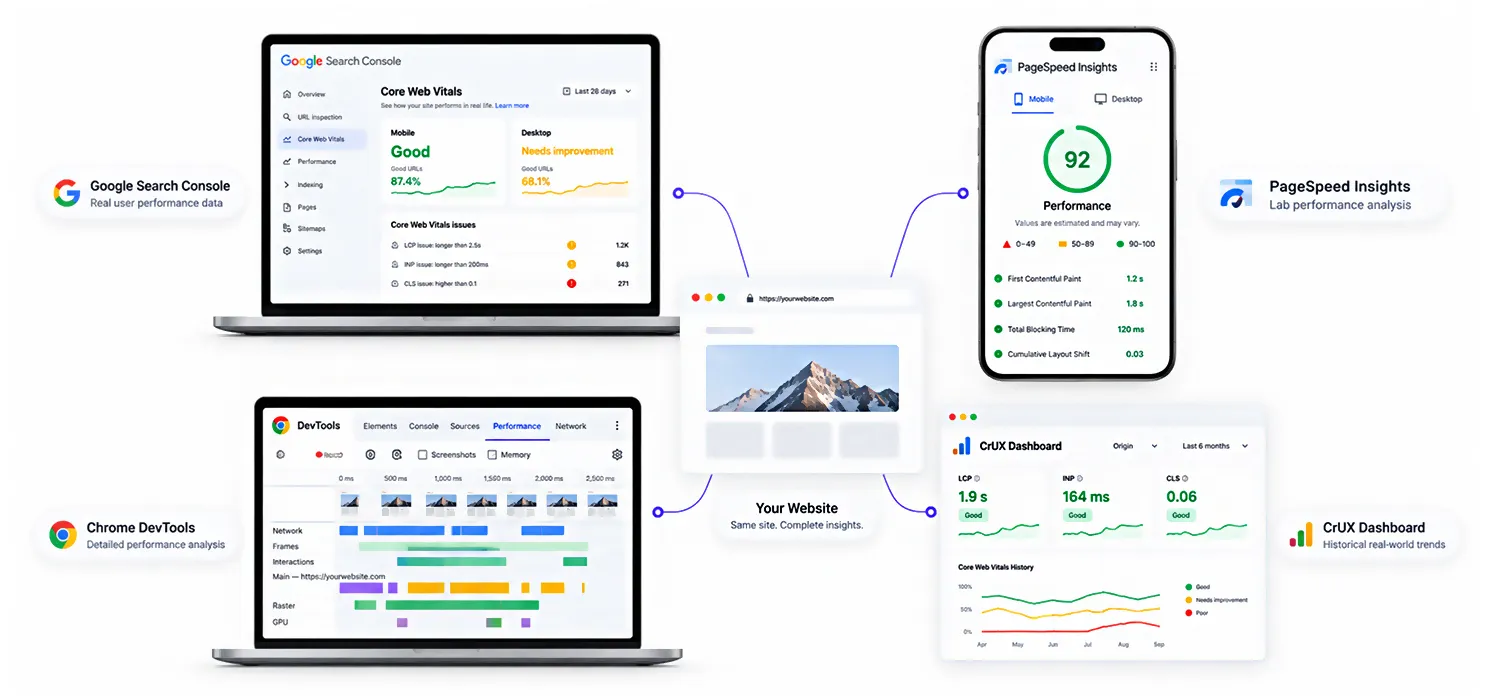
You don’t need anything paid to get a genuinely accurate picture of your site’s performance. Four free tools cover almost everything.
Google Search Console shows your Core Web Vitals report using real visitor data, grouped by URL and flagged as Good, Needs Improvement, or Poor. This is the closest thing to Google’s own opinion of your site, since it reflects actual visits rather than a simulated test.
PageSpeed Insights runs both a lab test and pulls field data (CrUX) when available, giving you a specific score alongside the exact issues holding it back on any individual page.
Chrome DevTools, specifically the Performance panel, lets you record what actually happens while a page loads or while you interact with it, which is essential for diagnosing INP issues that a simple score won’t explain on its own.
The CrUX Dashboard or CrUX API gives you historical trend data, useful for confirming whether a problem is new or has been present for months, and whether previous fixes actually moved the numbers over time.
How to check your LCP, INP, and CLS scores step by step
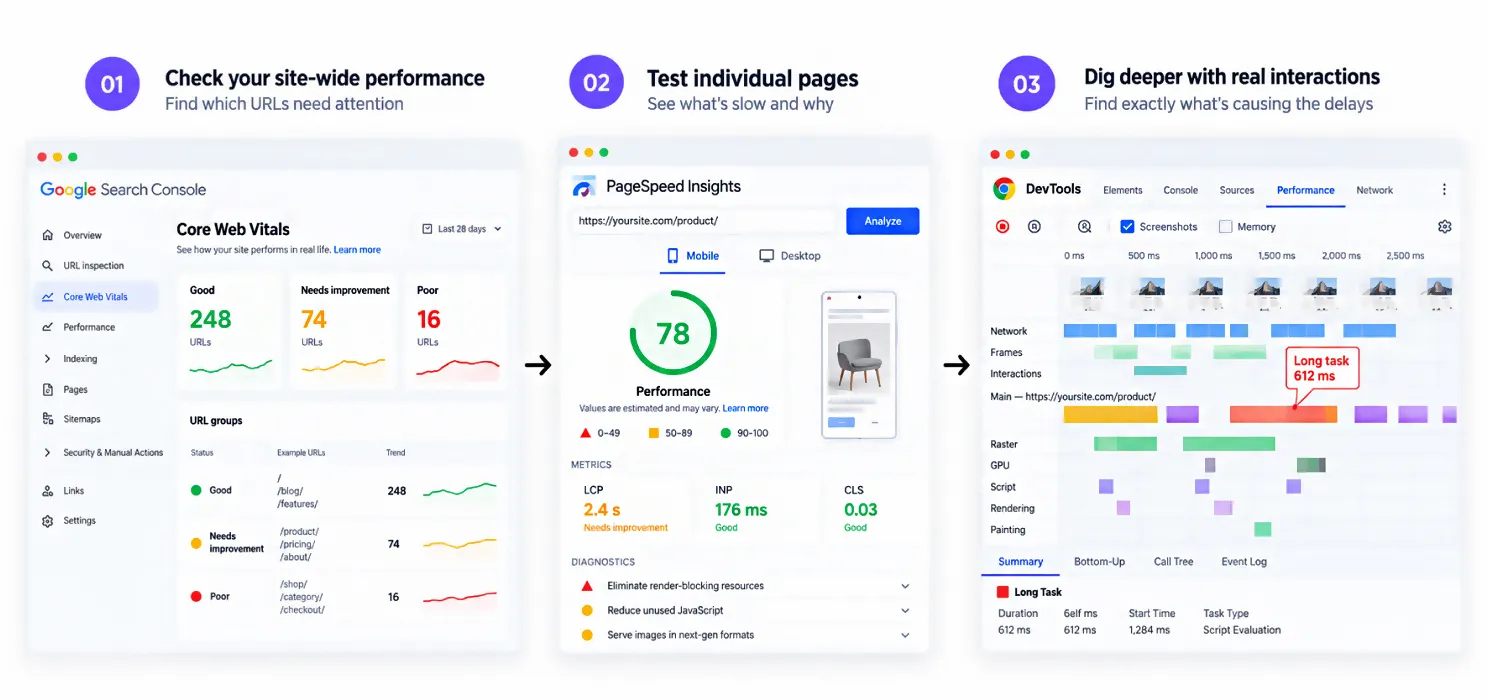
Start in Search Console rather than jumping straight to a single-page test. Open the Core Web Vitals report and look at how many URLs fall into each status category, since a handful of failing pages tells a very different story than most of your site failing.
From there, pick two or three representative pages, ideally your homepage, your highest-traffic landing page, and one deeper content or product page, and run each through PageSpeed Insights individually. Note the specific LCP, INP, and CLS numbers for each, along with whichever specific issues the report flags underneath the scores.
If INP looks poor on any page, open that page in Chrome DevTools, start a Performance recording, and interact with it the way a real visitor would, clicking a button or opening a menu. Long tasks blocking the main thread will show up clearly as extended bars in the recording, pointing you toward which script is actually causing the delay.
What should you look for beyond the raw scores?
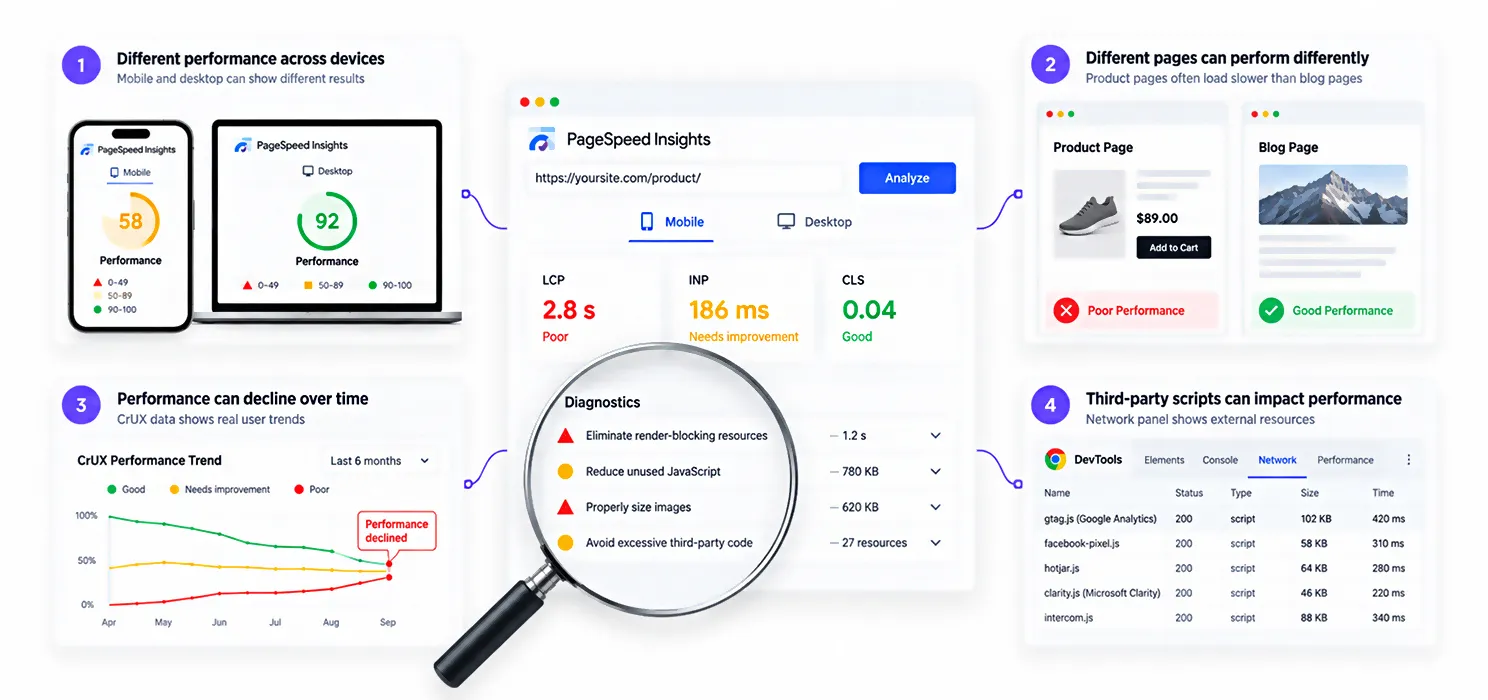
The numbers alone don’t tell the whole story. A few patterns are worth checking specifically.
Mobile versus desktop gaps. Mobile pass rates run consistently lower than desktop across the web, so check both separately rather than assuming a good desktop score means mobile is fine too.
Which templates are failing, not just which pages. If your product pages fail but your blog posts pass, that points to something specific to the product template, like a heavy image gallery or a checkout-adjacent script, rather than a site-wide issue.
Whether the problem is new or long-standing. The CrUX historical trend can show whether a metric recently got worse, which often points to a specific plugin update or added script, versus a problem that’s simply always been there.
Third-party script load. Open your page source or use DevTools’ Network panel to count how many external scripts load on a typical page, chat widgets, ad tags, tracking pixels, and analytics tools. A large number here is one of the most common causes of failing INP, as covered in our guide on how to fix LCP, INP, and CLS.
A WordPress speed audit checklist you can run in under an hour
Here’s a practical checklist covering the essentials, in the order that gets you the clearest picture fastest:
| Step | What To Check | Tool To Use |
| 1 | Overall Core Web Vitals status across all URLs | Google Search Console |
| 2 | LCP, INP, CLS scores on 2 to 3 representative pages | PageSpeed Insights |
| 3 | Mobile scores specifically, not just desktop | PageSpeed Insights (mobile tab) |
| 4 | Which specific script or task delays INP | Chrome DevTools Performance panel |
| 5 | Number of third-party scripts loading per page | DevTools Network panel |
| 6 | Whether images have explicit width and height set | Page source / DevTools Elements panel |
| 7 | Current Time to First Byte | PageSpeed Insights (Server response time) |
| 8 | Whether scores have worsened recently | CrUX Dashboard or historical CrUX data |
Working through this in order takes most people under an hour, and by the end you’ll know exactly which of the three metrics is your actual problem, rather than a vague sense that “the site feels slow.”
How do you know if you need to hire an agency after your audit?
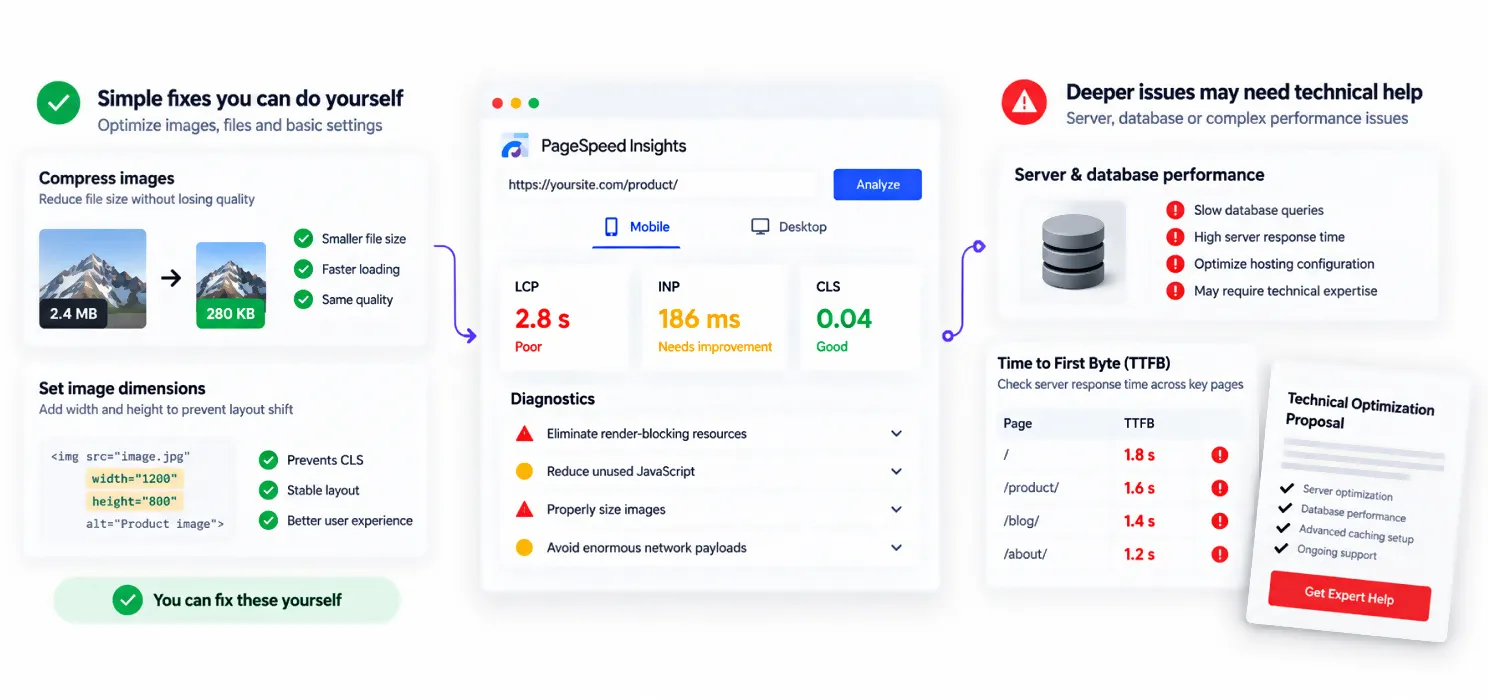
Your audit results usually make this decision for you. If most of your pages pass or sit close to passing, and the specific issues flagged are things like uncompressed images or missing width and height attributes, those are fixable without outside help, often just by installing or properly configuring a plugin.
If your audit reveals a high Time to First Byte across every page regardless of content, a database issue, or a pattern that persists no matter what frontend changes you make, that’s the signal covered in our guide on when a WordPress speed optimization service is worth it, since those root causes typically need direct diagnosis rather than a checklist.
A practical example
A small business ran through this exact checklist expecting to need a full agency engagement, since their homepage had been flagged as failing Core Web Vitals for months. The audit showed something more specific: only their product pages were failing, all three metrics, while their blog and homepage passed comfortably.
Digging into the product template specifically revealed a single image gallery plugin loading four unnecessary scripts, none of which were actually used on the live product pages, along with several product images missing explicit width and height attributes. Removing the unused plugin and fixing the image dimensions brought all three metrics on product pages into passing range within a week, without spending anything on outside help.
The audit didn’t just save money. It also meant that when they later did want expert input on a separate, more complex issue, they walked into that conversation already knowing exactly what wasn’t the problem.
Frequently Asked Questions
Find answers to common questions about WordPress Core Web Vitals audits, including which tools to use, how to check LCP, INP, and CLS, and when you may need professional help.
What is a Core Web Vitals audit, and do I really need one before hiring an agency?
A Core Web Vitals audit checks your site’s LCP, INP, and CLS scores using real visitor data and lab testing to identify specific performance issues. Running one yourself first is worth doing because it often reveals the problem is smaller or different than assumed, which can save significant money on an unnecessary or poorly scoped agency engagement.
What free tools can I use for a website performance audit?
Google Search Console’s Core Web Vitals report, PageSpeed Insights, Chrome DevTools’ Performance panel, and the CrUX Dashboard cover nearly everything needed for a thorough audit, all without any cost.
How long does a WordPress speed audit checklist take to complete?
Working through the core steps, checking Search Console, testing a few representative pages, reviewing third-party scripts, and checking Time to First Byte typically takes under an hour for someone with basic familiarity with these free tools.
Should I audit my whole site or just a few pages?
Start with an overall view in Search Console to see how many URLs are affected, then focus detailed testing on two or three representative pages, ideally your homepage, a high-traffic landing page, and a page from your most common template, such as a product or blog post page.
What's the difference between auditing LCP, INP, and CLS separately?
Each metric has different causes and different diagnostic tools. LCP issues usually show up clearly in PageSpeed Insights’ loading breakdown. INP requires Chrome DevTools’ Performance panel to see which specific script or task is causing the delay. CLS issues are often visible just by watching a page load and noting what shifts.
Can I fix Core Web Vitals issues myself after running an audit?
Often, yes. Common issues like uncompressed images, missing image dimensions, or unnecessary plugins loading unused scripts can typically be fixed directly once identified. More complex issues, like database bottlenecks or persistently high Time to First Byte across every page, usually need more specialized diagnosis.
How often should I re-run a Core Web Vitals audit?
Checking after any major change, a new plugin, a theme update, or a significant traffic shift, is good practice. Beyond that, a quarterly check is reasonable for most sites, since Core Web Vitals scores can drift gradually as new content and plugins get added over time.