6 mins read
What Causes Performance Bottlenecks in WordPress?
Share Article :


| Quick summary A bottleneck is the one slow step that holds up everything else. This guide explains what causes a WordPress performance bottleneck, walks through the stages of a page load, and shows how to find your slowest stage with free tools. You will learn to fix the biggest problem first instead of guessing, and finish with a simple method and a checklist. |
Picture a bottle of water turned upside down. It does not matter how wide the bottle is. The water can only come out as fast as the narrow neck allows.
Your website works the same way. You can compress images, add a CDN, and clean your database. But if one step in the chain is very slow, that step decides how fast your page feels.
Most owners fix whatever is easiest to fix. Smart owners find the neck of the bottle first. Let’s learn how.
What is a performance bottleneck?
A bottleneck is the slowest part of a process, the part that limits the whole. If your server takes two seconds to respond, it makes no difference that your images are tiny. Visitors still wait two seconds before anything starts.
This idea changes how you work. You do not need to fix everything. You need to find the biggest delay, fix it, and then look again. Often, the next bottleneck is a different one.
What happens when someone loads your page?
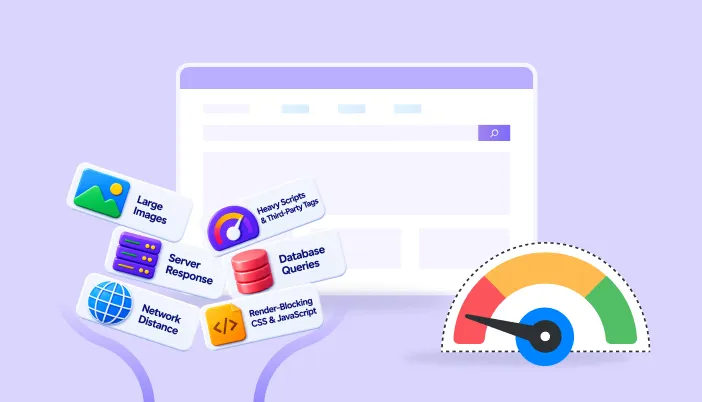
Every page load follows the same journey. A bottleneck can hide at any stage.
First, the visitor’s browser finds your server. Second, your server builds the page, using PHP and the database. Third, the page travels back over the network. Fourth, the browser downloads the files it needs, like images, styles, and scripts. Fifth, it paints the page on screen. And sixth, it runs scripts and responds to taps.
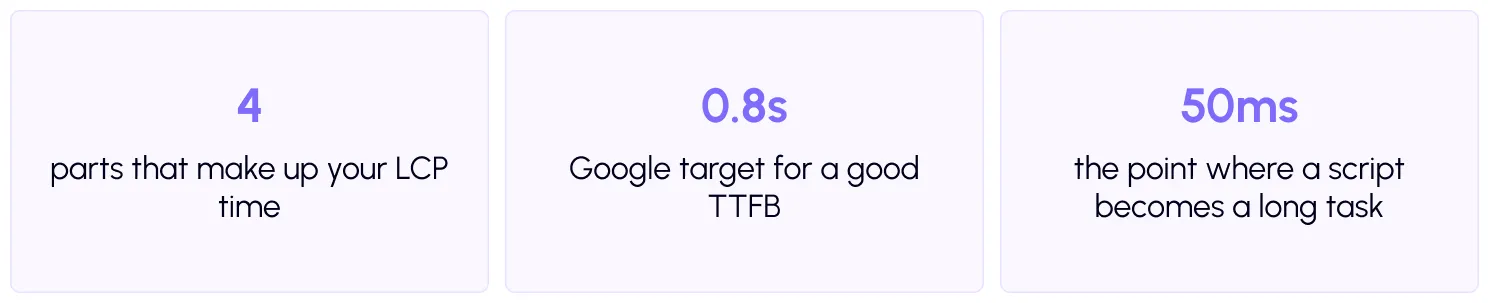
Google breaks Largest Contentful Paint into four parts: the time to first byte, the delay before the main resource starts loading, the time it takes to load, and the delay before it is drawn. That is a handy map of where time can go.
| Did you know? A page can fail Core Web Vitals for very different reasons. One site is slow because of its server. Another is slow because of one giant image. The score looks the same, but the fix is completely different. |
What are the most common WordPress bottlenecks?
Here is the journey again, this time as a table. For each stage, you can see the usual culprit, how to spot it, and what to do.
| Stage | Common bottleneck | How to spot it | Fix |
| Server response | No caching, slow hosting, old PHP, heavy plugins | High TTFB on uncached pages | Caching, better PHP and hosting, fewer plugins |
| Database | Slow queries, bloated tables | Slow admin, slow archives, slow queries in Query Monitor | Clean up, object caching, remove the offending plugin |
| Network distance | Visitors far from the server | Fast at home, slow abroad | CDN |
| File downloads | Large images, uncompressed files, too many requests | Big files in the network waterfall | WebP, compression, lazy load, fewer files |
| Rendering | Render-blocking CSS and JavaScript, late fonts | Blank screen for a long time | Minify, defer, optimize fonts |
| Interaction | Heavy scripts and third-party tags | Laggy taps, long tasks | Defer and delay scripts, remove unused tags |
Step 1: Measure
Run your home page, a typical article or product page and your most important landing page. Use the free SpeedyGo speed test, and look at mobile first. Save the Core Web Vitals and screenshots. Run each page three times and use the middle result.
Step 2: Locate the slowest stage
Now look at the order of events, called a waterfall. WebPageTest gives you a clear one. You can also open the Network tab in Chrome DevTools, which Google explains in its guide to the Network panel. Read it from left to right. Ask: how long before the first byte arrives? How long before the main image starts? Where are the gaps?
If the first byte arrives late, you have a server or caching bottleneck. If it arrives quickly but the page stays blank, look at render-blocking files. If the page appears fast but feels laggy, look at scripts.
Step 3: Size the biggest delay
Many problems exist, but one usually dominates. Rank what you find by how many seconds it costs. Tools like PageSpeed Insights list opportunities with estimated savings. The top of that list is where to start.
Step 4 to 6: Fix one, re-test, repeat
Change only one thing at a time, then re-test. This is how you know what worked. Once the biggest delay is smaller, run the analysis again. The bottleneck will usually move to a new stage. Keep going until the page meets Google’s targets and feels fast on a real phone.
Which SpeedyGo tools match which bottleneck?
Once you know the stage, the fix is often a setting.
For a slow server response, use full-page caching and object caching. For heavy images, use WebP conversion and lazy load. For distance, connect CDN integration. For render-blocking files, use CSS optimization and JavaScript optimization. For laggy taps, use defer scripts and JS interaction delay.
If you are not sure which one applies, the optimization presets give a safe place to start, and paid plans include human support to help you read your results.
| Note No plugin can fix every bottleneck. A very weak server or a heavy custom theme may need hosting or developer work. A good analysis tells you that early, so you do not waste time on the wrong fix. |
Your bottleneck analysis checklist
- Test key pages on mobile, three runs each
- Save your Core Web Vitals and screenshots
- Open a waterfall in WebPageTest or Chrome DevTools
- Check how long the first byte takes
- Check which files are largest and which block rendering
- Look for long scripts and third-party tags
- Use Query Monitor if the admin or archives are slow
- Rank issues by seconds saved
- Fix the biggest one first, and only one at a time
- Re-test, then look for the next bottleneck
Common mistakes to avoid
The first mistake is fixing what is easy instead of what is big. Compressing images feels productive, but it will not help if the server is the problem.
The second is changing many settings at once. You lose the ability to tell what worked.
The third is trusting one score. Look at the waterfall and at real-user data, not only at the number. UseQuery Monitor when the database is the suspect.

Frequently Asked Questions
Here are answers to some common questions about WordPress performance bottlenecks, slow server response times, caching issues, heavy plugins, database queries, and how to identify and fix the biggest problems affecting your website’s speed.
What causes performance bottlenecks in WordPress?
Common causes are slow hosting, no caching, heavy plugins, slow database queries, large images, render-blocking files and heavy third-party scripts.
How do I find the bottleneck on my WordPress site?
Run a mobile speed test, look at the waterfall in WebPageTest or Chrome DevTools, and find the slowest stage: server response, file downloads, rendering, or scripts.
Why did compressing images not speed up my site?
Your bottleneck may be elsewhere, such as slow server response or render-blocking files. Fixing a non-bottleneck gives little gain.
What is a good TTFB for WordPress?
Google considers around 0.8 seconds or less good. If yours is higher on uncached pages, caching, PHP and hosting are the first things to check.
Can plugins cause bottlenecks?
Yes. Some add scripts and styles to every page, run slow database queries or contact outside servers. Test plugins one at a time to find the guilty one.
Can SpeedyGo find my bottleneck?
SpeedyGo offers a free speed test that shows your scores and main issues, and its tools address common bottlenecks like caching, images, scripts and CDN. Paid plans include human support.