
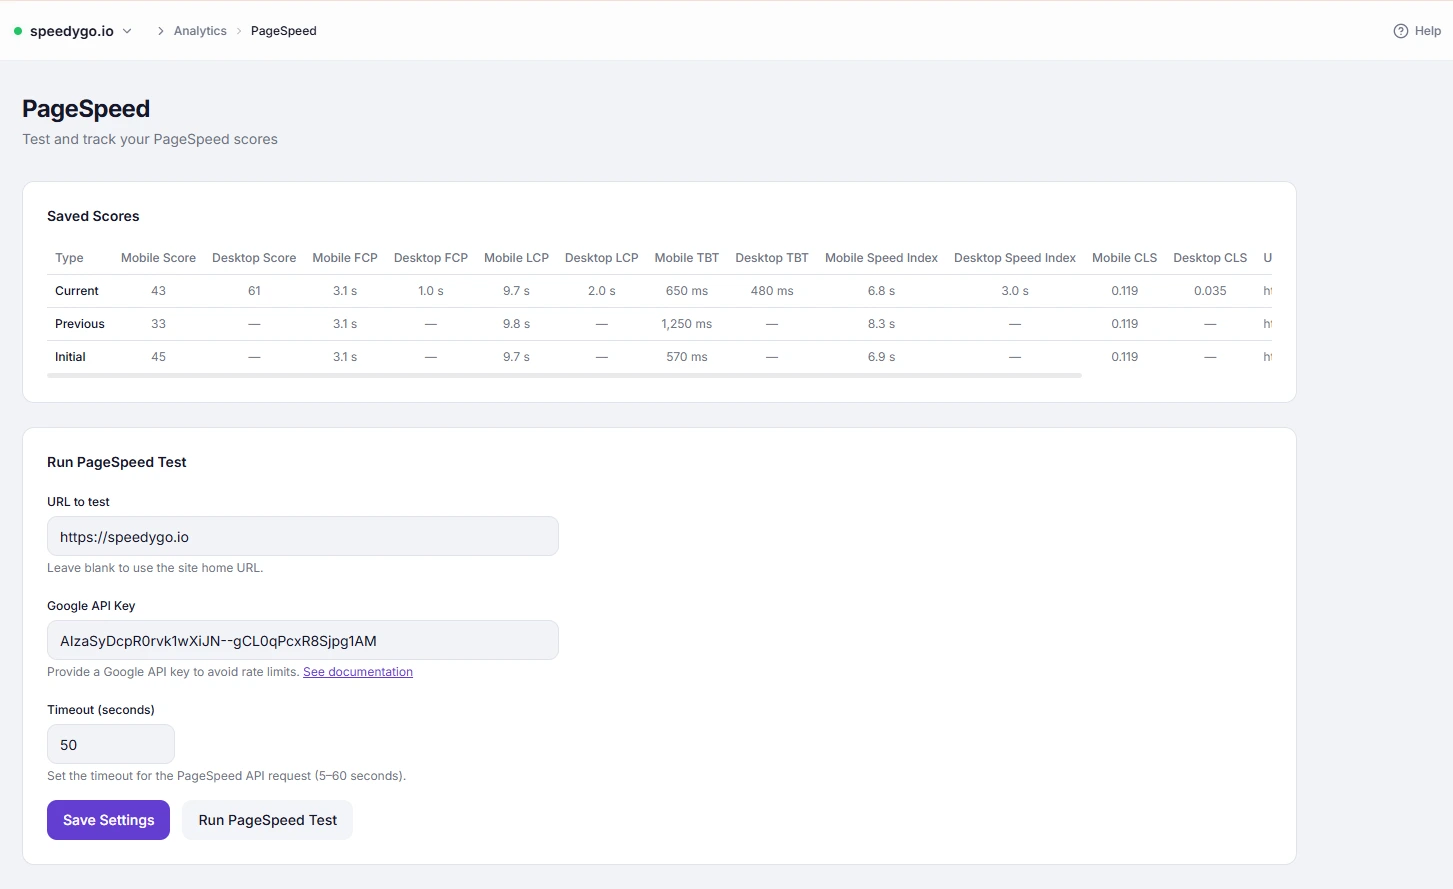
SpeedyGo’s PageSpeed Analytics runs tests for both mobile and desktop simultaneously and displays the results side by side. This lets you track performance separately for each device type, since mobile and desktop scores often differ significantly.
Dashboard path: Analytics → PageSpeed
Plan: Pro only
Why Mobile and Desktop Scores Differ #
Google PageSpeed Insights simulates different conditions for each device type:
| Factor | Mobile simulation | Desktop simulation |
|---|---|---|
| Network speed | Slow 4G (10 Mbps) | Fast broadband |
| CPU speedd | Throttled (mid-range phone) | Full speed |
| Viewport width | 360px (typical mobile) | 1350px |
| Score weighting | Stricter — harder to achieve high scores | More lenient |
A site scoring 90 on desktop may score 65 on mobile for the same content — this is normal.
Results Layout #
The PageSpeed results table shows both device types for each test run:
| Column | Mobile | Desktop |
|---|---|---|
| Score | Performance 0–100 | Performance 0–100 |
| FCP | First Contentful Paint | First Contentful Paint |
| LCP | Largest Contentful Paint | Largest Contentful Paint |
| TBT | Total Blocking Time | Total Blocking Time |
| Speed Index | Visual load speed | Visual load speed |
| CLS | Cumulative Layout Shift | Cumulative Layout Shift |
Each saved test stores both sets of results, labelled Current, Previous, and Initial (baseline).
Core Web Vitals Thresholds #
Google uses these thresholds for both mobile and desktop:
| Metric | Good | Needs Improvement | Poor |
|---|---|---|---|
| LCP | < 2.5s | 2.5s – 4s | > 4s |
| TBT | < 200ms | 200ms – 600ms | > 600ms |
| CLS | < 0.1 | 0.1 – 0.25 | > 0.25 |
| FCP | < 1.8s | 1.8s – 3s | > 3s |
Optimizing for Mobile #
Mobile scores are more difficult to improve because of simulated CPU and network throttling. The settings that have the most impact on mobile:
| Setting | Impact on mobile |
|---|---|
| JS Interaction Delay | Highest — eliminates TBT entirely |
| Defer Scripts | High — removes render-blocking JS |
| WebP Conversion | High — smaller images on slow connections |
| Lazy Load | High — only loads visible images |
| Gzip / Brotli Compression | High — smaller files on slow 4G |
| Full Page Caching | High — eliminates server processing time |
| CSS / JS Minification | Medium — reduces file sizes |
How to Read Score History #
| Row | Description |
|---|---|
| Current | Most recent test |
| Previous | Test before the current one |
| Initial | First ever test (your baseline before optimization) |
Compare Current vs Initial to measure your total improvement. Compare Current vs Previous to see the impact of your most recent changes.
Tips #
Tip: Focus on mobile scores — Google’s Search ranking uses mobile performance as the primary signal (mobile-first indexing). A 10-point mobile improvement is more valuable than a 10-point desktop improvement for SEO.
Tip: Run a test before making any SpeedyGo configuration change, then run another after. This gives you a precise before/after comparison for each individual optimization.
Note: PageSpeed scores can vary by 3–5 points between runs due to server load and network variability. Run 2–3 tests and average the results for a reliable measurement.


