
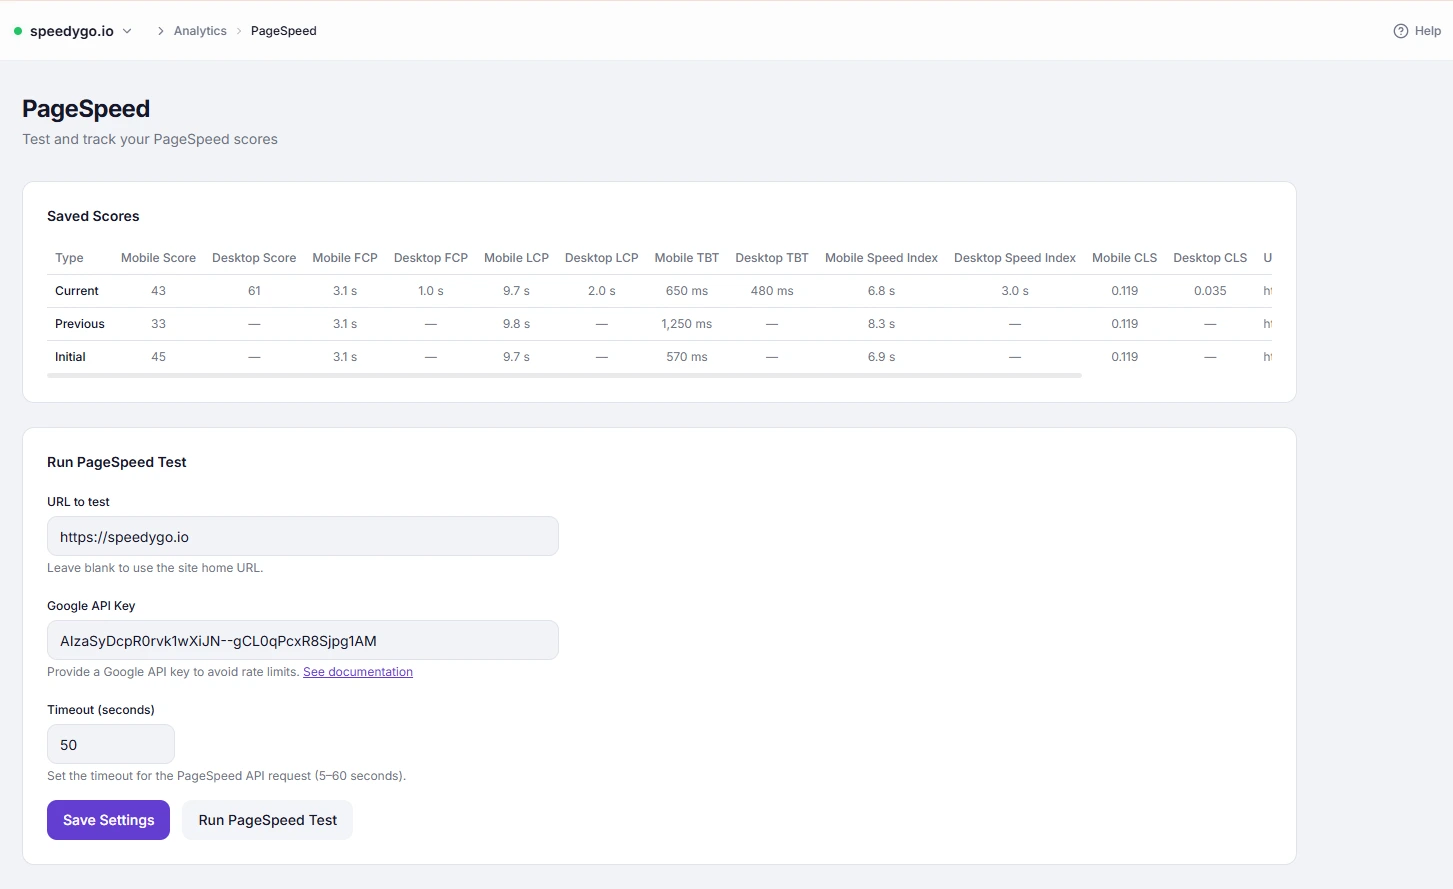
PageSpeed Analytics lets you run Google PageSpeed Insights tests directly from the SpeedyGo dashboard and track your performance scores over time. Results are stored so you can compare current, previous, and baseline (initial) runs.
Dashboard path: Analytics → PageSpeed
Plan: Pro only — Free plan users see an upgrade prompt.
Before You Start #
You need a Google PageSpeed Insights API key to run tests. Get one free from the Google Cloud Console:
- Create a project in Google Cloud Console.
- Enable the PageSpeed Insights API.
- Generate an API key and copy it.
Configuration #
| Field | Description |
|---|---|
| URL to test | Full URL of the page to analyse (e.g. https://yoursite.com/). If left blank, the domain from your SpeedyGo license is used. |
| Google API Key | Your PageSpeed Insights API key from Google Cloud. |
| Timeout (seconds) | How long to wait for the Google API to respond. Default: 250. |
Click Save Settings to store these values before running a test.
How to Run a Test #
- Go to Analytics → PageSpeed.
- Enter the URL you want to test.
- Paste your Google API Key.
- Adjust Timeout if needed.
- Click Save Settings.
- Click Run PageSpeed Test.
Results appear in the history table once the test completes (typically 10–30 seconds).
Results Table #
Each saved test records both mobile and desktop scores:
| Column | Description | Good threshold |
|---|---|---|
| Score | Overall Performance score (0–100) | ≥ 90 |
| FCP | First Contentful Paint — time until first content is visible | < 1.8s |
| LCP | Largest Contentful Paint — time until the largest element is visible | < 2.5s |
| TBT | Total Blocking Time — time the main thread was blocked | < 200ms |
| Speed Index | How quickly content is visually populated | < 3.4s |
| CLS | Cumulative Layout Shift — visual stability (elements jumping) | < 0.1 |
| URL | The page that was tested | — |
| When | Timestamp of the test | — |
Score History #
The table shows three rows per test run:
| Row | Description |
|---|---|
| Current | Most recent test result |
| Previous | The test before the current one |
| Initial | The very first test run (your baseline) |
Use the Initial row to measure your total improvement since you started using SpeedyGo.
Optimization Score on Dashboard #
The dashboard overview shows an Optimization Score card (letter grade: A+, A, B, C, D, F). This grade is derived from your most recent PageSpeed score:
| Score | Grade |
|---|---|
| ≥ 95 | A+ |
| ≥ 90 | A |
| ≥ 80 | B |
| ≥ 70 | C |
| ≥ 60 | D |
| < 60 | F |
The card only appears once you have run at least one PageSpeed test. Until then it is hidden.
Troubleshooting #
| Symptom | Likely cause | Fix |
|---|---|---|
| “API key invalid” error | Wrong or expired API key | Re-generate the key in Google Cloud Console |
| Test times out | Timeout too low or site is slow to respond | Increase Timeout to 300 or higher |
| Score is lower than expected | Test run without cache warming | Ensure Full Page Caching is enabled and cache is warmed before testing |
| No improvement after changing settings | Settings not saved or CDN not synced | Save Settings, trigger a CDN sync, wait for sync to complete, then re-test |
Tips #
Tip: Always run a test before and after changing SpeedyGo settings. The Initial baseline row captures your pre-optimization state so you can quantify the improvement.
Tip: Run tests from both mobile and desktop. Mobile scores are typically lower and are more heavily weighted by Google Search ranking signals.
Note: PageSpeed scores vary slightly between runs due to server load and network conditions. Run 2–3 tests and average the results for a more accurate picture.


